Advertiser disclosure: This money app complaint report uses public data and contains no partner links. How we make money.
Short answer
What do money app complaints show? Consumers filed 82,774 complaints with the federal consumer bureau about the 26 money-app companies SafeMobileBanking.com has reviewed, from November 1, 2025 to October 31, 2026. 16.4% were about fraud, scams or unauthorized transactions. Companies reported closing 5.4% with monetary relief and answered 99.4% on time.
Data pulled: November 17, 2026, from the CFPB Consumer Complaint Database. Download the data (CSV).
Key findings from the money app complaint report
- 82,774 complaints in 12 months. That’s the total for 26 reviewed companies, not counting Experian’s credit bureau entry.
- Fraud and scams: 16.4% overall. 13,553 complaints fell in the fraud, scam or unauthorized-transaction categories listed in the method below.
- Two companies hold most of them. Block, Inc. (Cash App and Afterpay) and PayPal Holdings (PayPal and Venmo) account for 10,303 of the 13,553, or 76.0%.
- Same fraud share, different outcomes. About a third of complaints about each of those two were fraud or scam related (35.3% and 34.5%). PayPal Holdings reported monetary relief on 18.9% of all its complaints; Block, Inc. reported it on 0.15% (24 of 16,161).
- Chime ranks third by volume. Chime Financial had 12,665 complaints; 10.9% were fraud or scam related, and Chime reported monetary relief on 5.4%.
- Nine of 22 companies reported no monetary relief at all. Among companies with 100 or more complaints, 9 reported closing none with monetary relief.
- Response times are high almost everywhere. 99.4% got a timely response. Among companies with 100 or more complaints, the lowest timely rates were Klarna (93.5%) and Robinhood (95.5%).
Money app complaints by company
The table lists every company with a full review on SafeMobileBanking.com. Each name links to its review. Percentages are shares of that company’s own complaints.
| Company | CFPB company name | Complaints | Fraud or scam related | Closed with monetary relief | Timely response |
|---|---|---|---|---|---|
| Experian (Experian Boost) † | Experian Information Solutions Inc. | 2,039,909 | 0.4% | 0.01% | 100.0% |
| Cash App and Afterpay (Block) | Block, Inc. | 16,161 | 35.3% | 0.15% | 99.1% |
| PayPal and Venmo | Paypal Holdings, Inc | 13,316 | 34.5% | 18.9% | 100.0% |
| Chime | Chime Financial Inc | 12,665 | 10.9% | 5.4% | 100.0% |
| Affirm | Affirm Holdings, Inc | 8,727 | 2.2% | 0.0% | 100.0% |
| Zelle (Early Warning Services) | Early Warning Services, LLC | 6,107 | 8.0% | 0.0% | 100.0% |
| Ally | ALLY FINANCIAL INC. | 6,028 | 1.1% | 2.8% | 100.0% |
| SoFi | SOFI TECHNOLOGIES, INC. | 3,743 | 4.4% | 6.8% | 100.0% |
| Kikoff | Kikoff Inc. | 3,634 | 2.1% | 0.0% | 100.0% |
| Klarna | Klarna AB | 2,098 | 5.0% | 8.2% | 93.5% |
| Robinhood | ROBINHOOD MARKETS INC. | 1,875 | 7.2% | 0.0% | 95.5% |
| Possible Finance | Possible Financial Inc | 1,628 | 2.0% | 0.06% | 97.5% |
| Upstart | Upstart Holdings, Inc. | 1,494 | 1.3% | 0.74% | 99.9% |
| MoneyLion | MoneyLion Inc. | 1,120 | 3.8% | 0.54% | 99.2% |
| Coinbase | Coinbase, Inc. | 1,067 | 23.9% | 38.2% | 98.2% |
| Credit Karma | Credit Karma, LLC | 985 | 3.7% | 13.7% | 97.3% |
| Wise (TransferWise) | TransferWise Ltd | 572 | 18.9% | 11.5% | 96.5% |
| Dave | Dave Operating, LLC | 425 | 4.7% | 0.24% | 96.5% |
| Albert | Albert Corporation | 280 | 7.5% | 0.0% | 100.0% |
| Google (Google Pay) | Google Compare Credit Cards Inc. | 238 | 27.3% | 0.0% | 100.0% |
| Revolut | Revolut Technologies Inc. | 187 | 10.7% | 0.0% | 98.9% |
| Brigit (Bridge IT) | Bridge IT, Inc. | 149 | 2.0% | 0.0% | 99.3% |
| Acorns | Acorns Grow Incorporated | 116 | 6.9% | 0.0% | 100.0% |
| EarnIn (Activehours) * | Activehours | 86 | 2.3% | 4.7% | 100.0% |
| Greenlight * | Greenlight Financial Technology, Inc | 29 | 10.3% | 0.0% | 100.0% |
| Rocket Money (Truebill) * | TRUEBILL, INC | 24 | 4.2% | 45.8% | 100.0% |
| Plaid * | PLAID INC. | 20 | 5.0% | 0.0% | 95.0% |
| Cleo | No entry found | 0 | n/a | n/a | n/a |
| Apple Pay | No entry found | 0 | n/a | n/a | n/a |
* Fewer than 100 complaints, so its percentages can swing on a few cases. † Experian’s entry is a credit bureau entry; nearly all complaints are about credit reports, not Experian Boost, so it’s left out of totals and charts. The Ally row covers all Ally Financial products, mostly auto loans. The Zelle row covers Early Warning Services, the network operator; banks that offer Zelle answer their own complaints, and those aren’t counted here.
Which money apps get the most fraud and scam complaints?
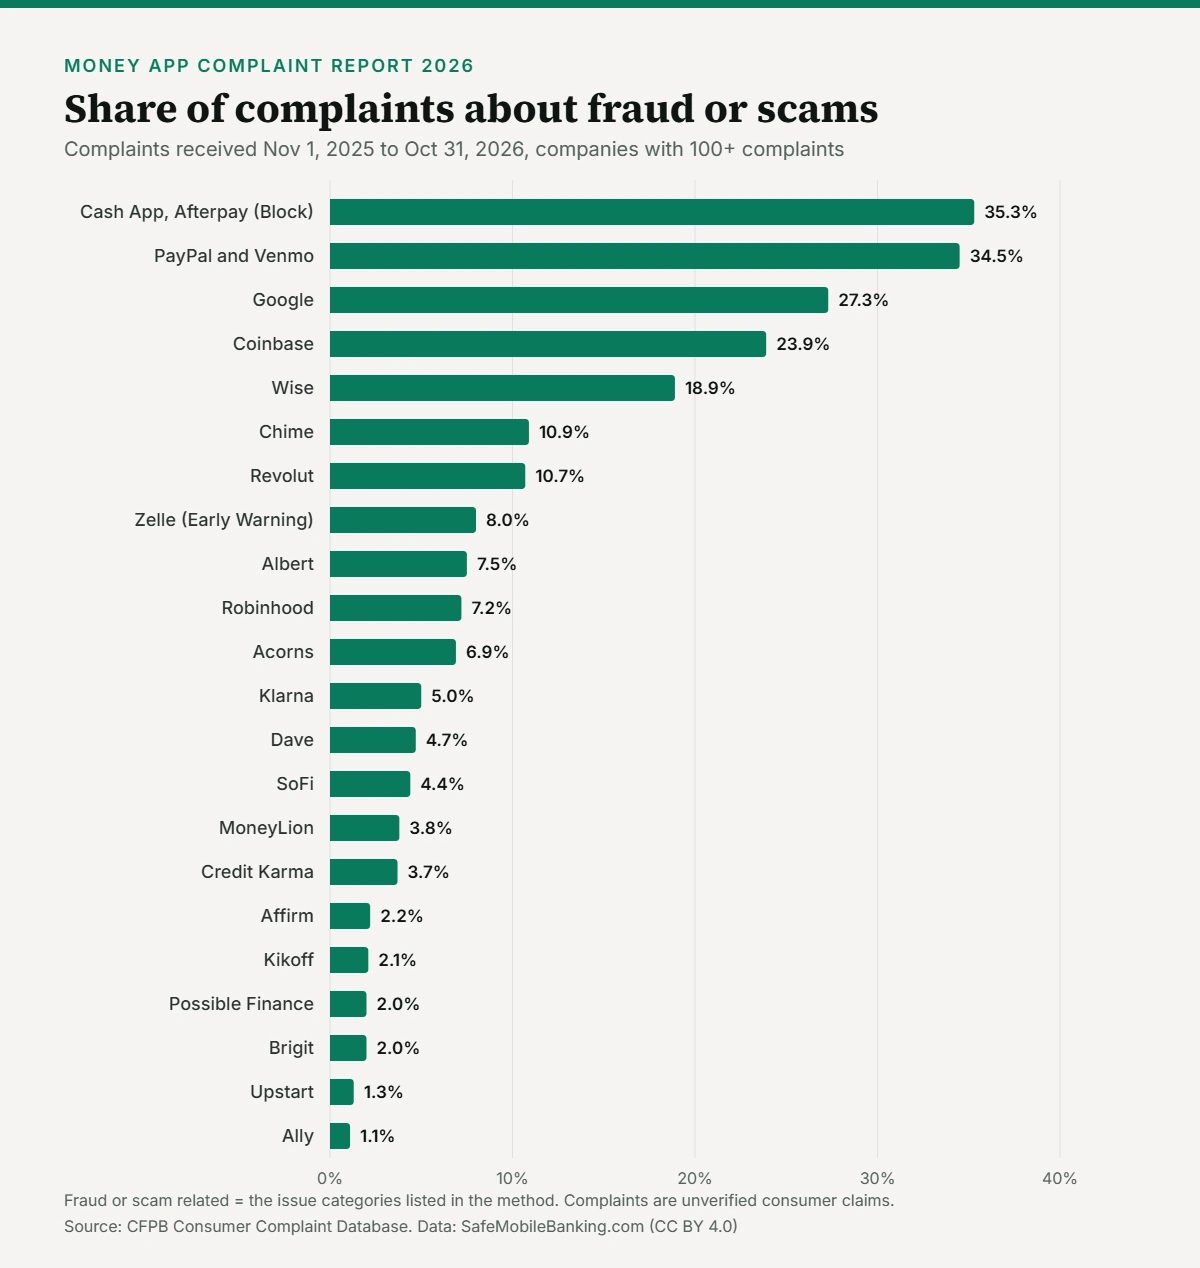
Payment and transfer apps sit at the top. Lenders and credit builders sit near the bottom, where complaints are mostly about credit reporting, billing and collections. A high share doesn’t mean an app is less safe. It shows what consumers complained about once they did complain. For how scams target app users, see Facebook Marketplace scams and how to report a scam.
How often did companies report monetary relief?
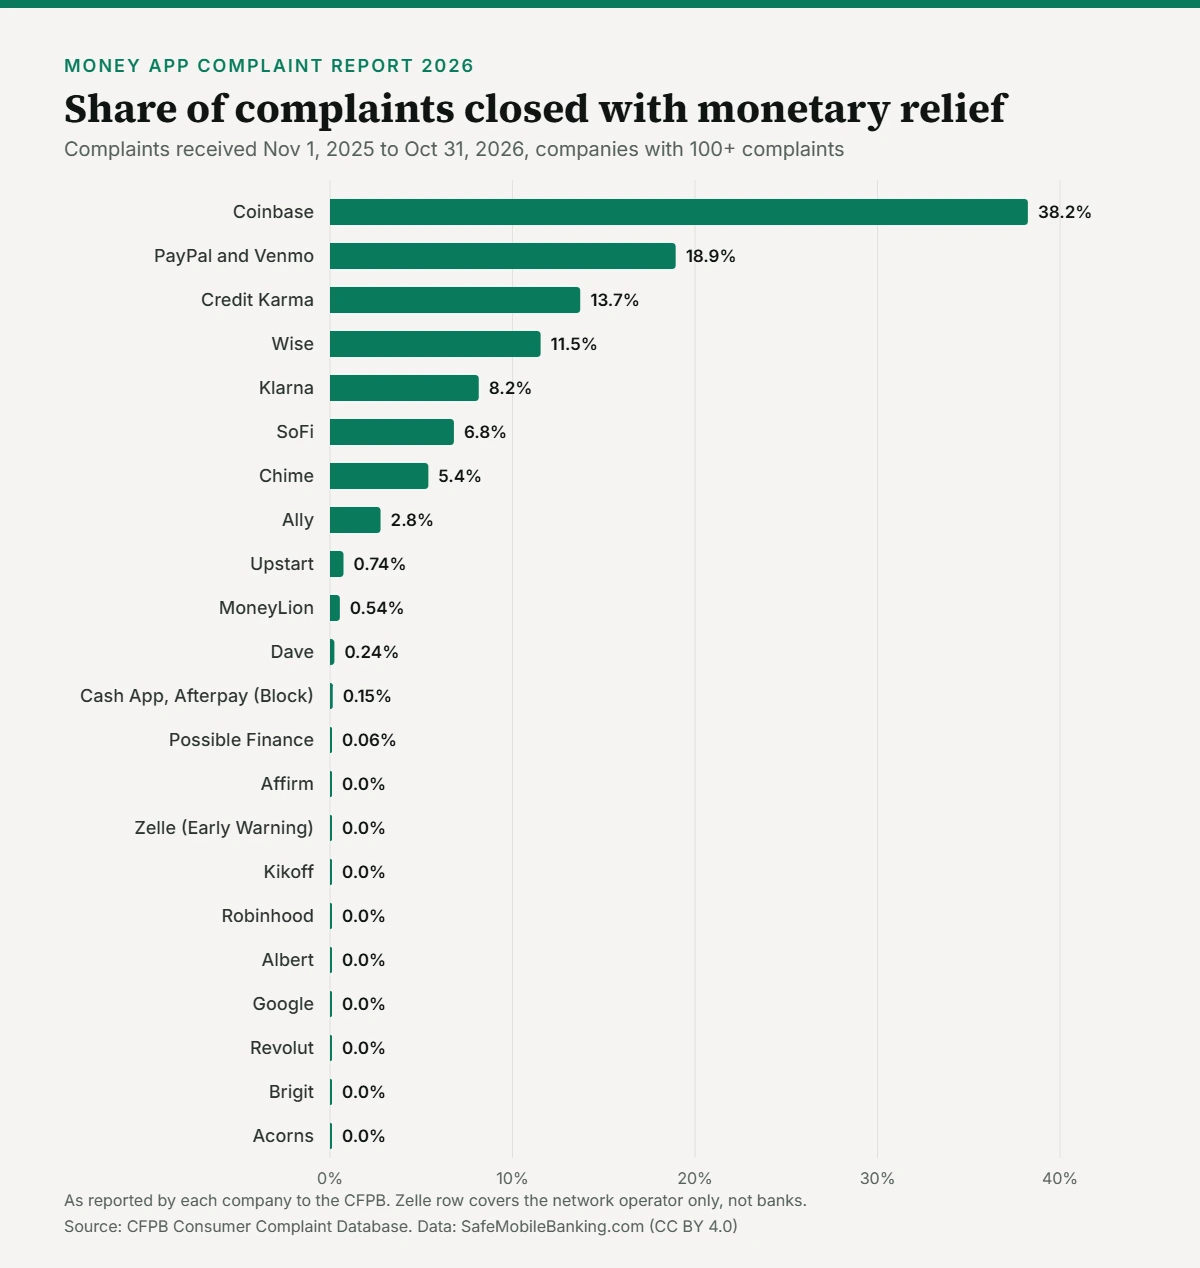
“Closed with monetary relief” is the company’s own label in its response to the bureau. Most complaints at most companies were “closed with explanation.” A company can also give money back outside the complaint process, and that wouldn’t show here.
Method
- Source: the CFPB Consumer Complaint Database public API, queried November 17, 2026.
- Window: complaints received November 1, 2025 through October 31, 2026.
- Companies: every company with a full review on SafeMobileBanking.com. We matched each to its CFPB company name by searching the database. Cleo and Apple Pay had no matching entry.
- Fraud or scam related: complaints whose issue is “Fraud or scam,” “Unauthorized transactions or other transaction problem,” “Unauthorized withdrawals or charges” or “Problem with fraud alerts or security freezes,” plus the sub-issue “Debt was result of identity theft.” Each complaint has one issue, so none is counted twice.
- Monetary relief: complaints the company reported as “Closed with monetary relief,” divided by all complaints, including ones still in progress.
- Timely response: complaints marked timely, divided by all complaints.
- No per-user rates. We don’t divide by customer counts because we can’t verify them. The bureau notes that companies with more customers may get more complaints.
- Limits: complaints are published after the company responds or after 15 days, so the last weeks of the window may still grow. The database isn’t a statistical sample of all customers.
Complaints are consumers’ claims as logged by the Consumer Financial Protection Bureau. The bureau doesn’t verify them, and a complaint isn’t proof of wrongdoing.
Use this data
You’re free to share and adapt the charts and table with credit. Download the CSV. Data: SafeMobileBanking.com (CC BY 4.0).
Money app complaint report FAQ
Where does this complaint data come from?
It comes from the Consumer Financial Protection Bureau’s public Consumer Complaint Database. Consumers file complaints, the bureau sends them to the company, and the company responds. We pulled the counts through the bureau’s public API on November 17, 2026, for complaints received November 1, 2025 through October 31, 2026.
Does a high complaint count mean an app is unsafe?
No. Complaints are consumers’ claims, and the bureau doesn’t verify them. Bigger companies usually get more complaints because they have more customers. We don’t publish per-user rates because customer counts aren’t verified. Use the shares to see what people complain about, then read each full review.
What counts as a fraud or scam complaint here?
We counted complaints whose issue was “Fraud or scam,” “Unauthorized transactions or other transaction problem,” “Unauthorized withdrawals or charges” or “Problem with fraud alerts or security freezes,” plus the sub-issue “Debt was result of identity theft.” These are the categories consumers pick when they file.
Why is Zelle’s monetary relief share zero?
The Zelle row covers Early Warning Services, which runs the Zelle network. People usually use Zelle through their own bank, and banks answer their own complaints under their own names. Those bank complaints aren’t in this report, so this row doesn’t show refunds banks may have made.
Can I use these charts in my story?
Yes. The data and charts are free to use under CC BY 4.0. Credit “Data: SafeMobileBanking.com” and link to this page. The CSV download has every figure in the table.
Sources
- CFPB Consumer Complaint Database
- CFPB complaint database API documentation
- Creative Commons Attribution 4.0
This report is information, not financial advice.